Plotting with Matplotlib & Seaborn
Pandas integrates well with popular visualization libraries like Matplotlib and Seaborn to create insightful plots from your data.
Basic Plotting with .plot()
Pandas DataFrames have a .plot() method that acts as a wrapper around matplotlib.pyplot.plot(). This makes it easy to create basic plots.
import pandas as pd
import matplotlib.pyplot as plt

data = {'x': [1, 2, 3, 4, 5], 'y': [2, 3, 5, 4, 6]}
df = pd.DataFrame(data)

# Create a line plot
df.plot(x='x', y='y')
plt.title("Simple Line Plot")
plt.xlabel("X-axis")
plt.ylabel("Y-axis")
plt.grid(True)
plt.show()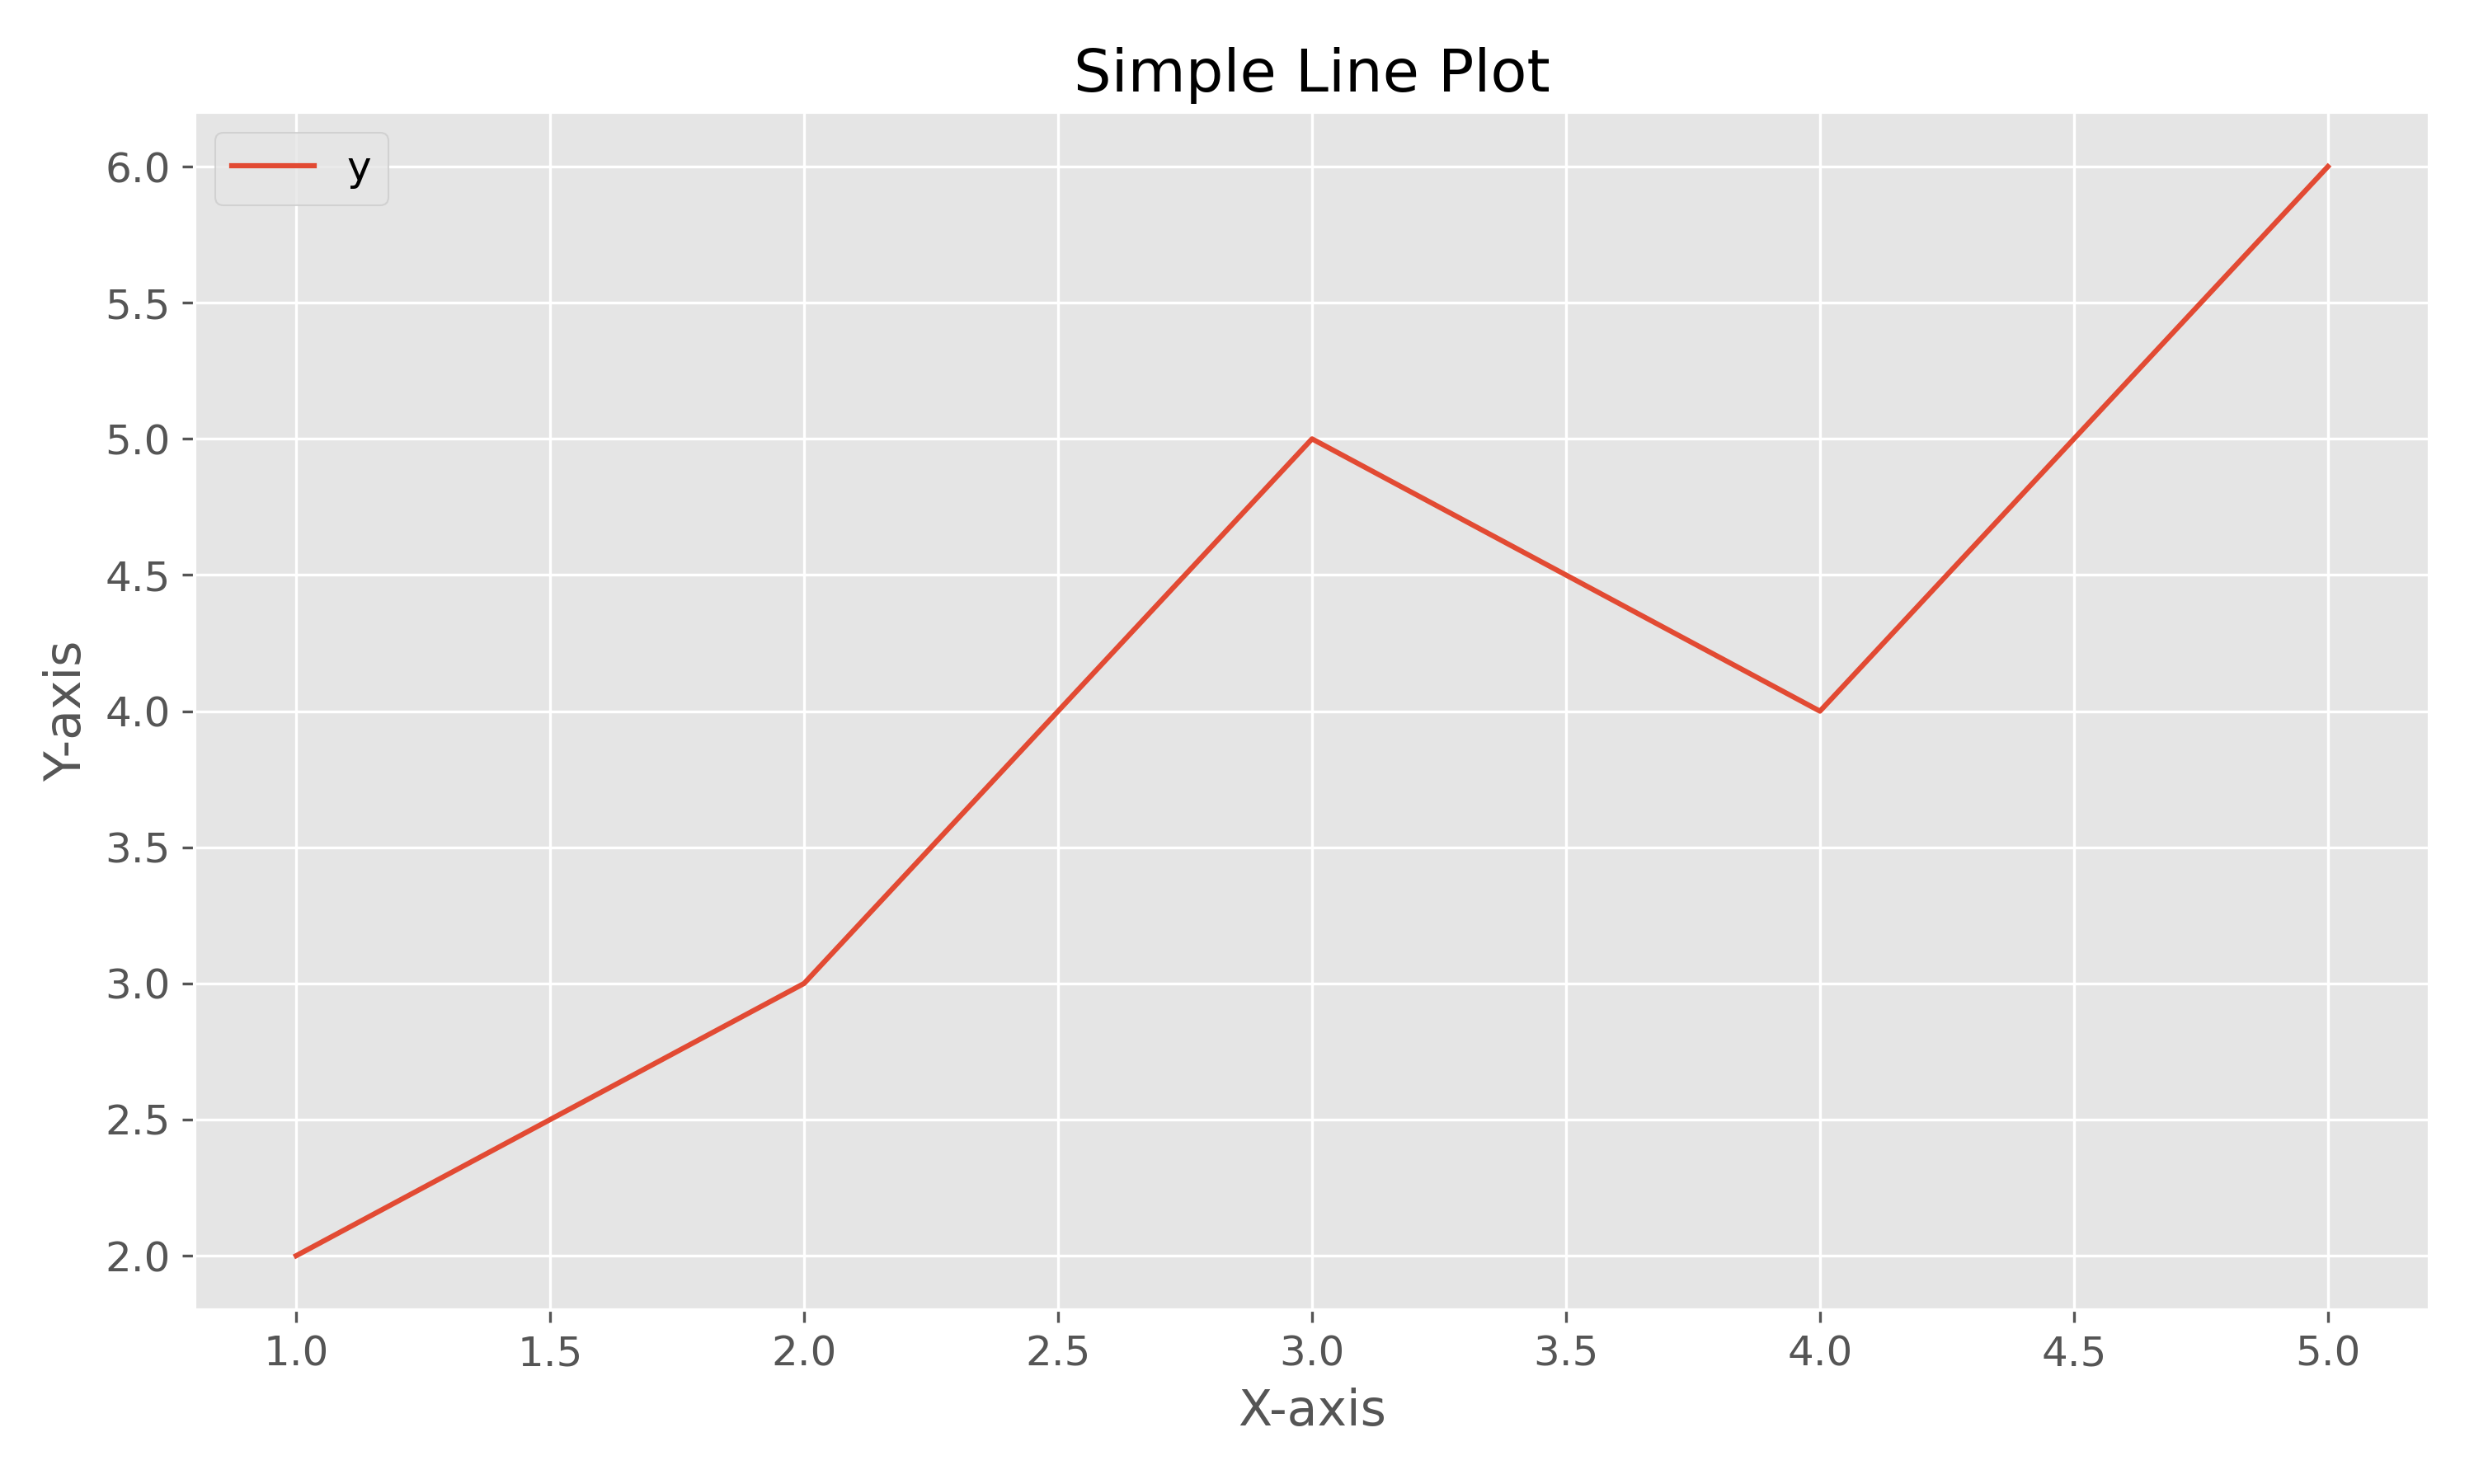
You can create different kinds of plots by specifying the kind parameter.
import pandas as pd
import matplotlib.pyplot as plt

data = {'category': ['A', 'B', 'C', 'D'], 'value': [10, 20, 15, 25]}
df = pd.DataFrame(data)

# Create a bar plot
df.plot(kind='bar', x='category', y='value')
plt.title("Bar Plot")
plt.xlabel("Category")
plt.ylabel("Value")
plt.xticks(rotation=0)
plt.show()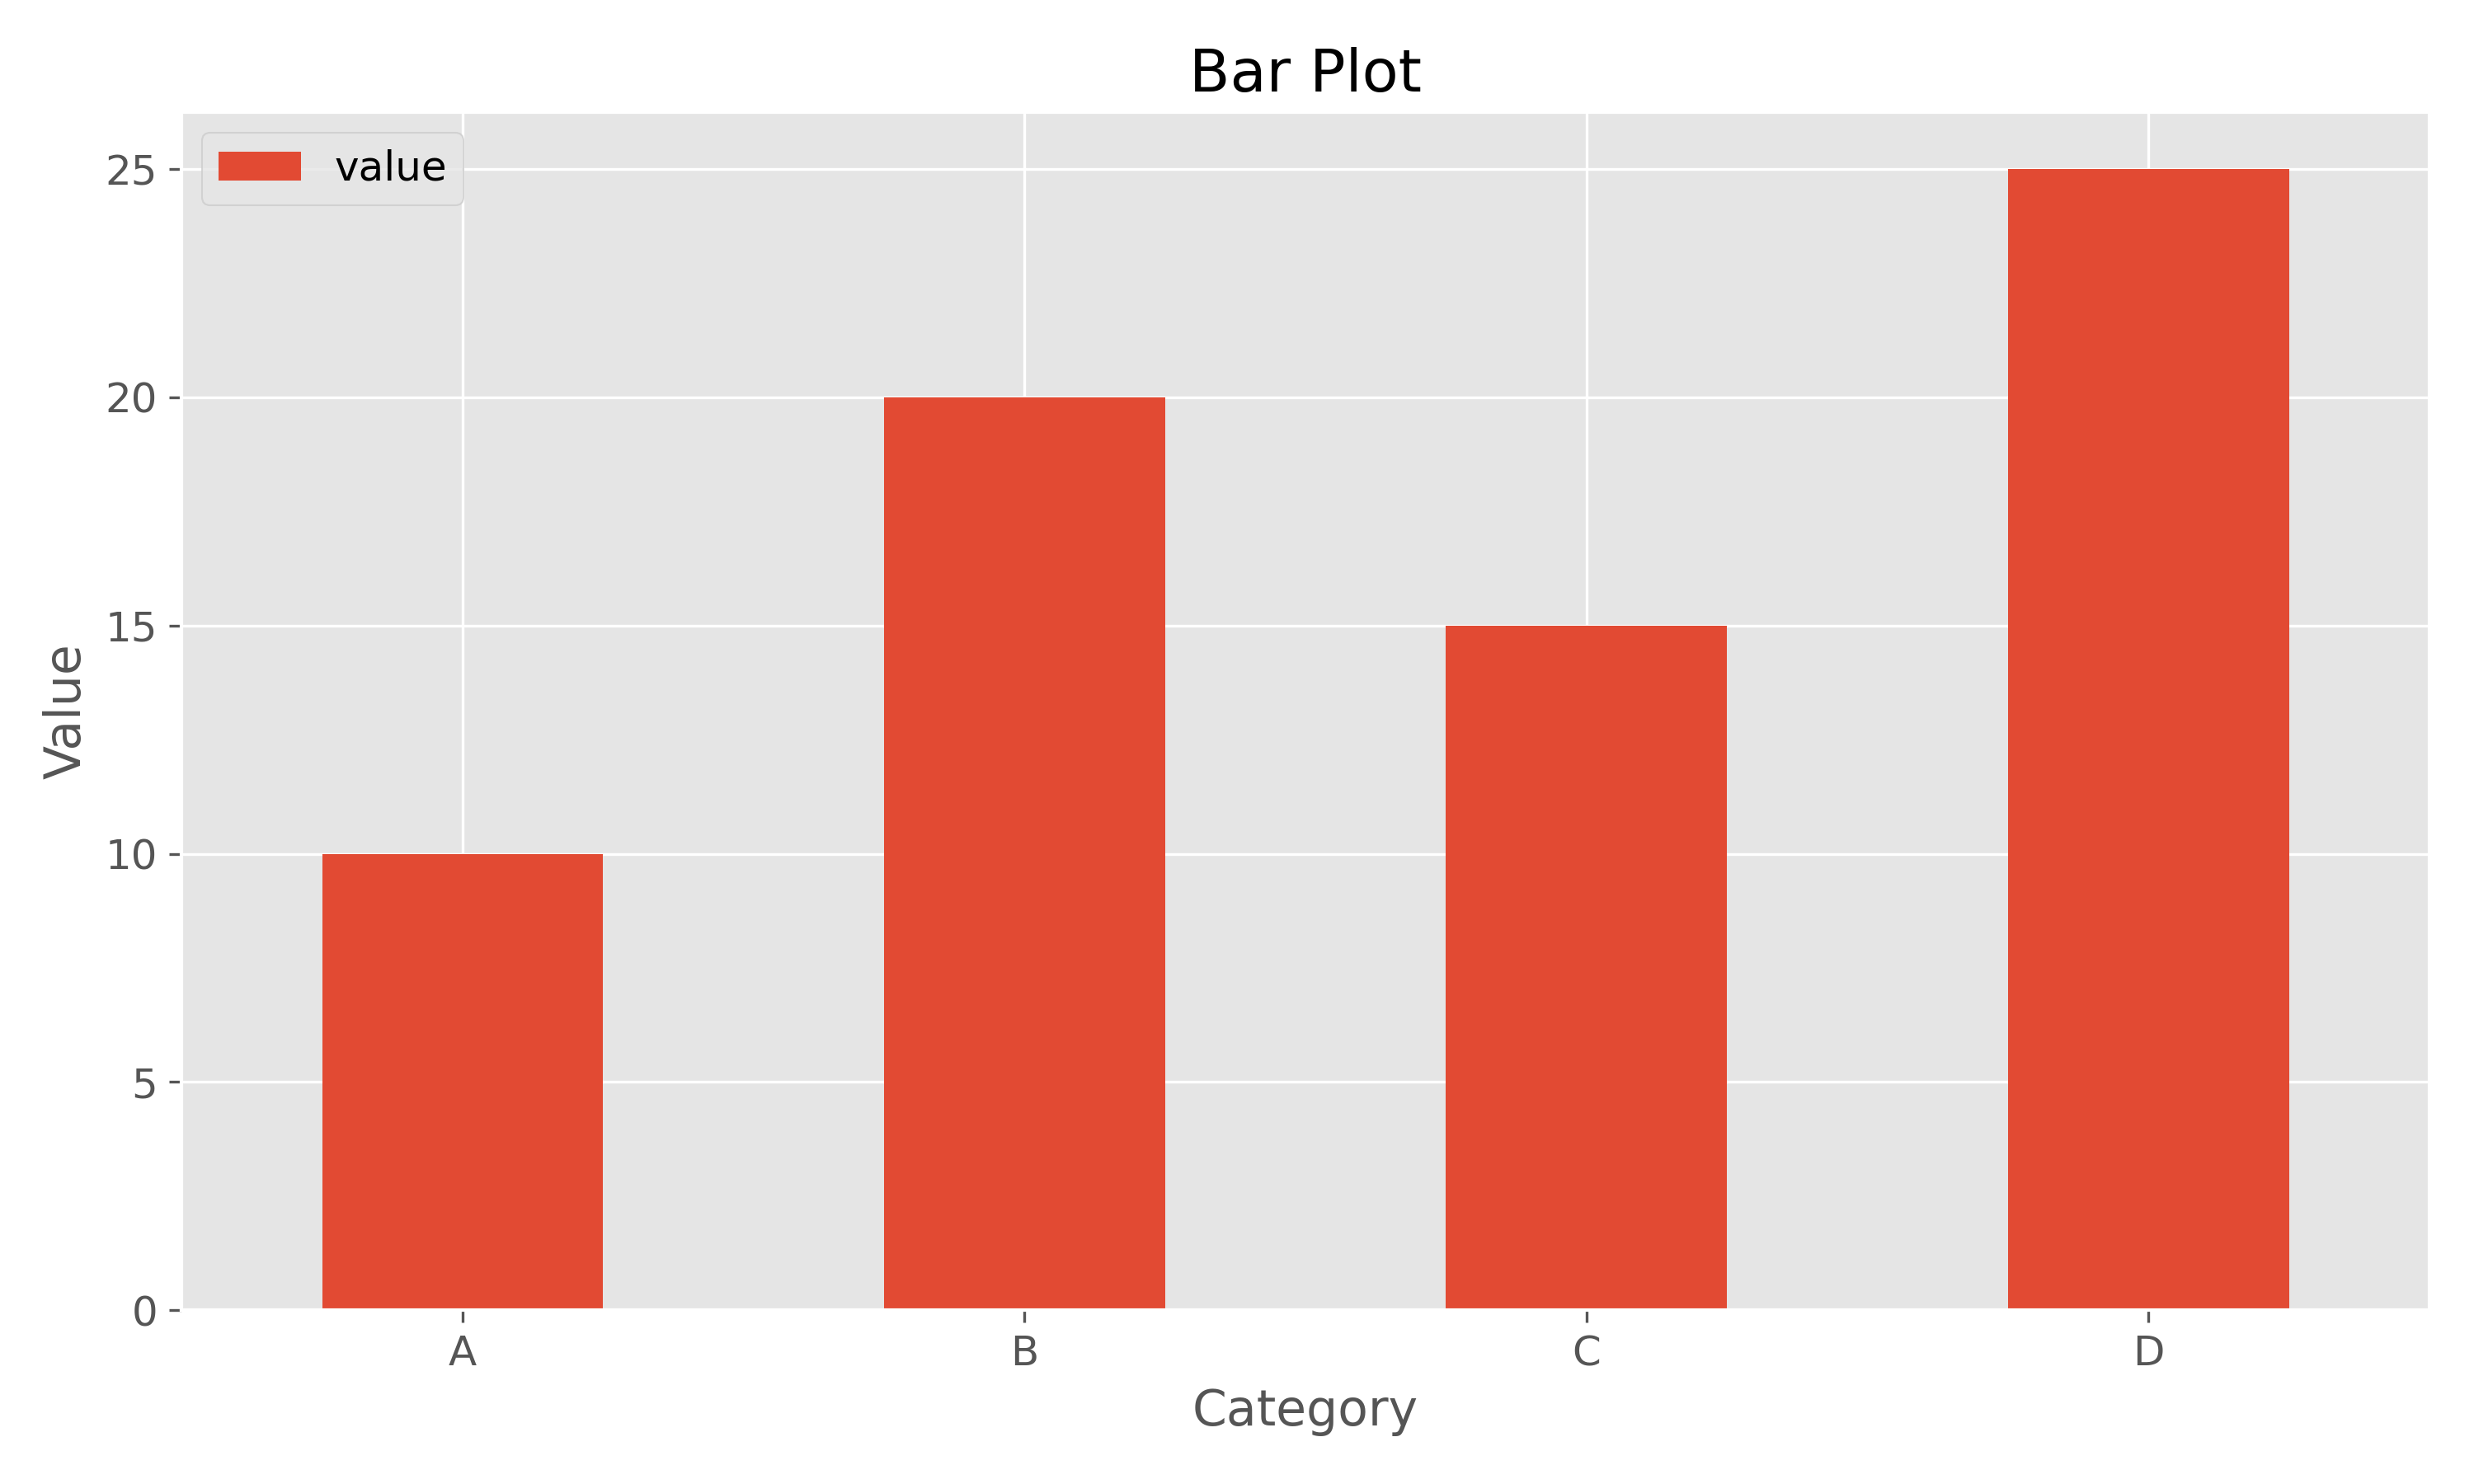
Advanced Plotting with Seaborn
Seaborn is a statistical data visualization library based on Matplotlib. It provides a high-level interface for drawing attractive and informative statistical graphics.
Scatter Plot with Seaborn
import pandas as pd
import seaborn as sns
import matplotlib.pyplot as plt

data = {'x': [1, 2, 3, 4, 5, 6, 7, 8],
      'y': [2, 3, 5, 4, 6, 8, 7, 9],
      'category': ['A', 'A', 'A', 'A', 'B', 'B', 'B', 'B']}
df = pd.DataFrame(data)

# Create a scatter plot colored by category
sns.scatterplot(data=df, x='x', y='y', hue='category')
plt.title("Scatter Plot with Seaborn")
plt.show()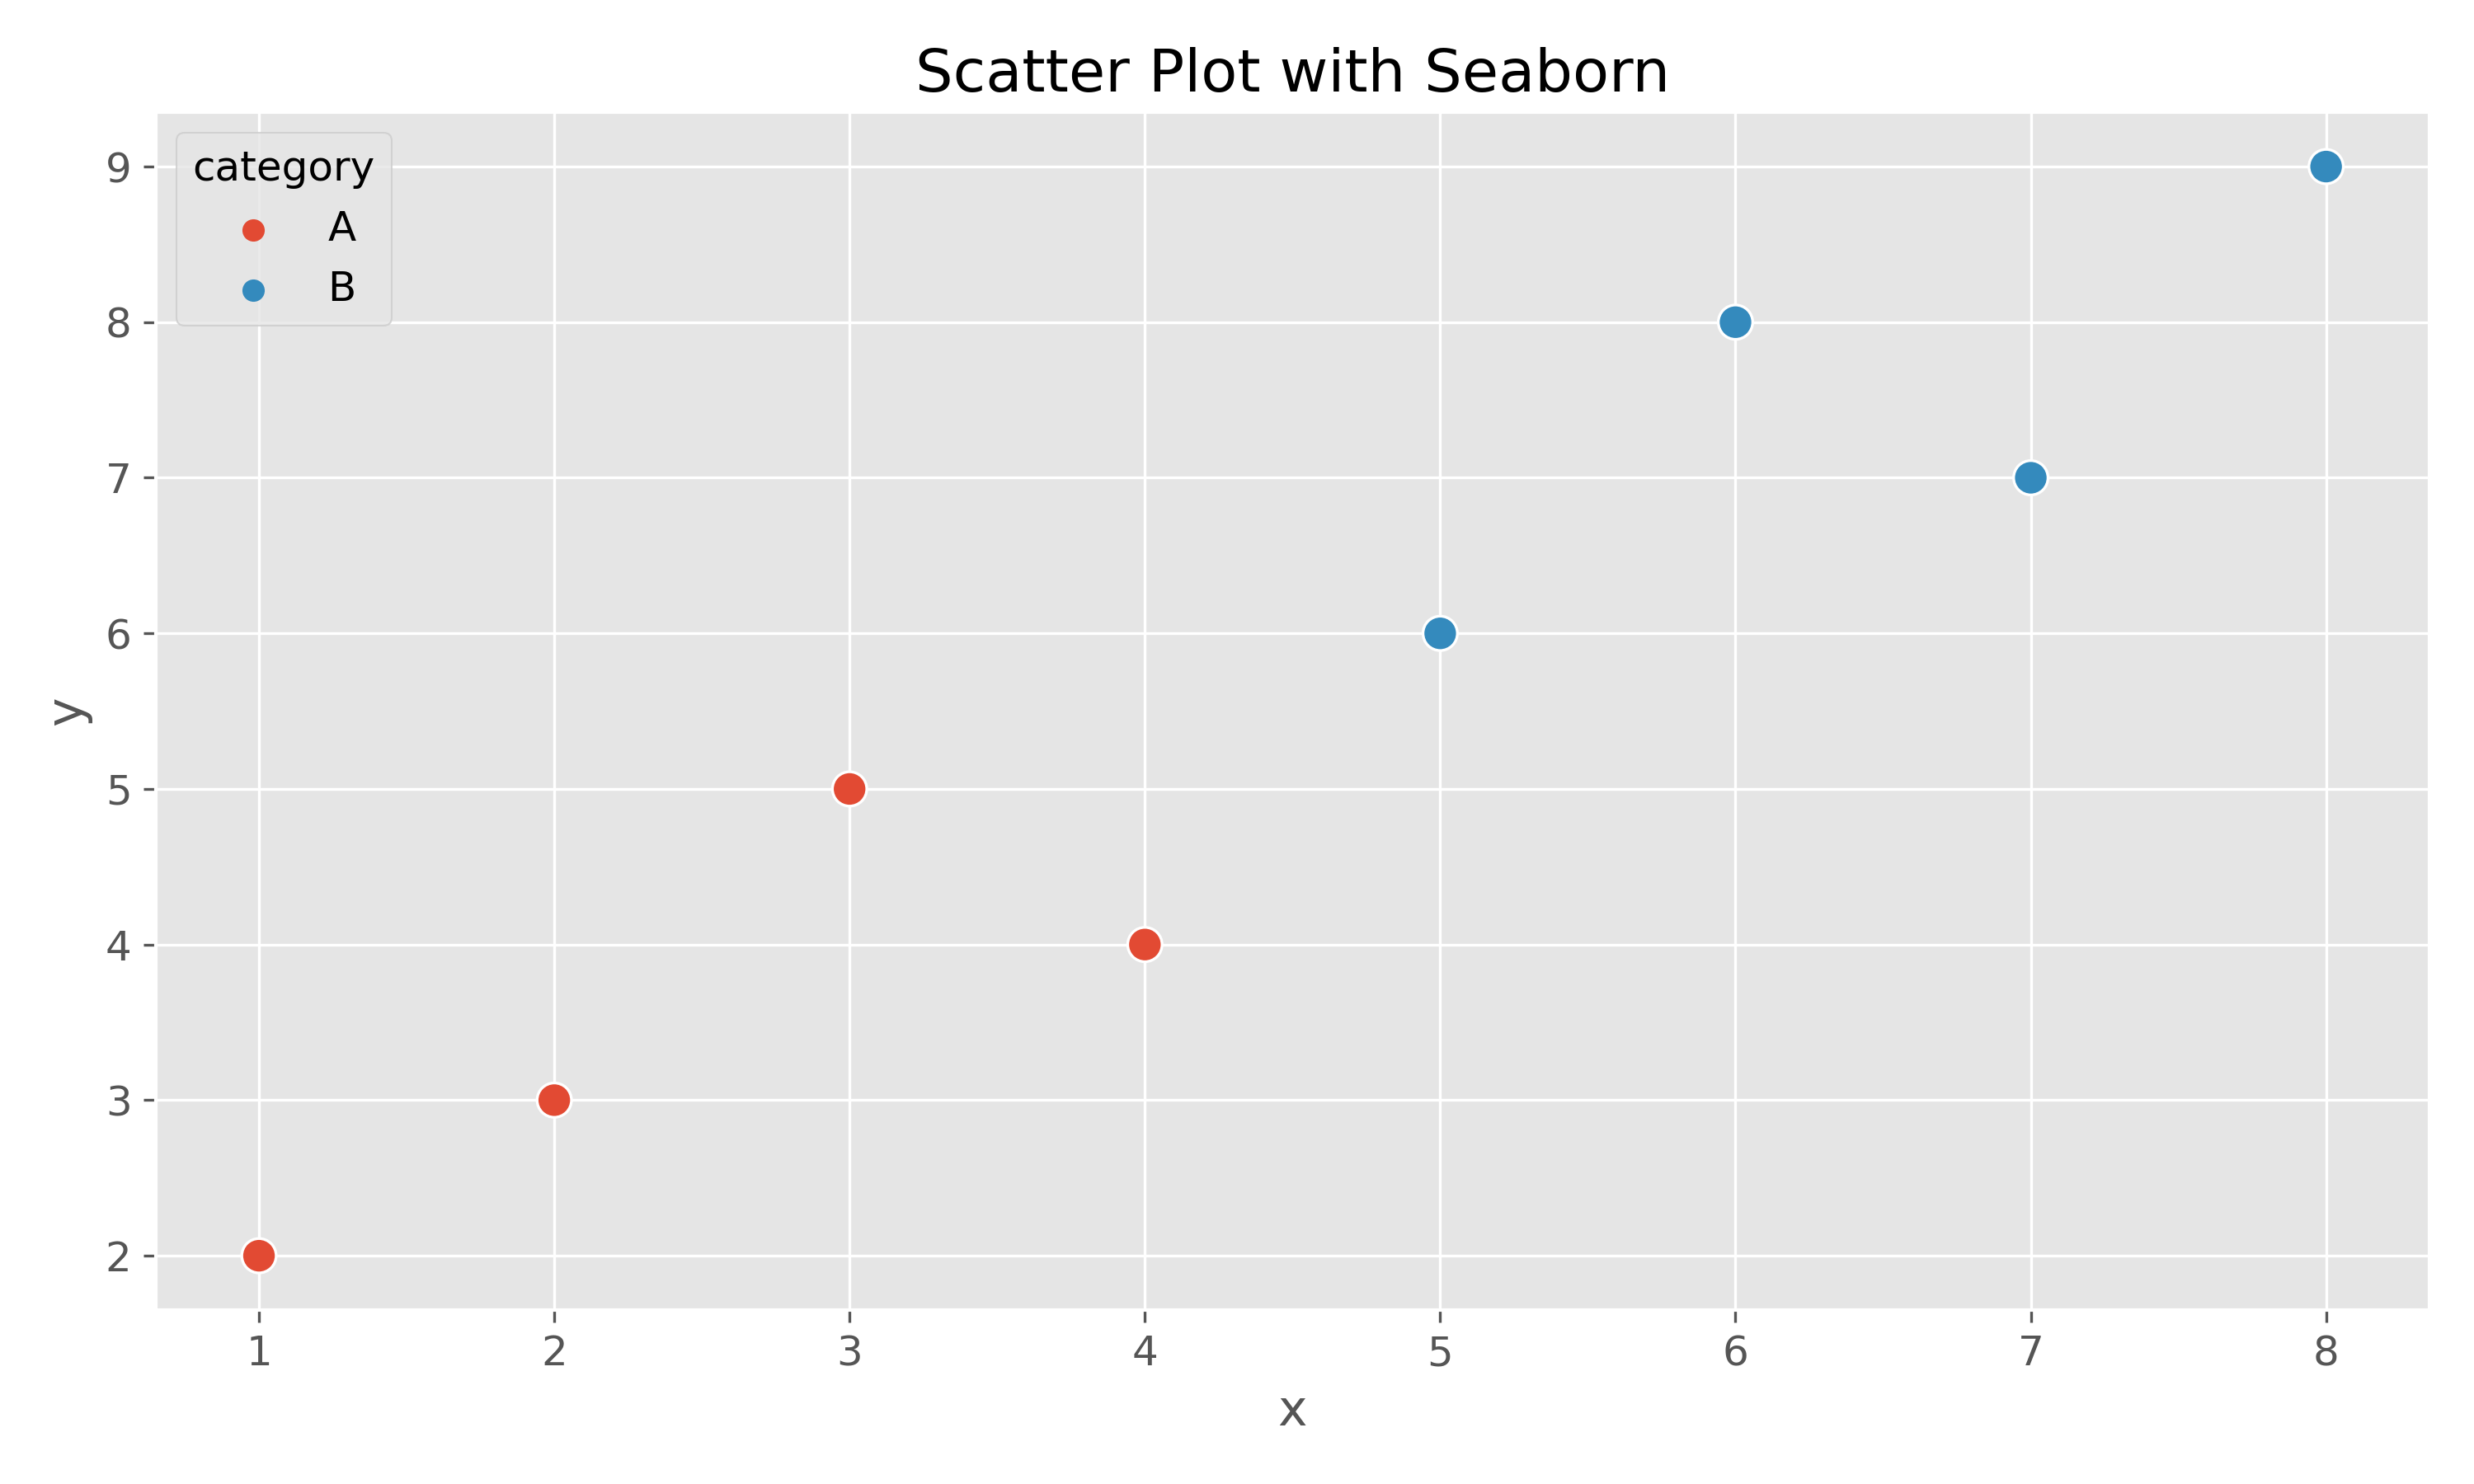
Histogram with Seaborn
Histograms are useful for visualizing the distribution of a single variable.
import pandas as pd
import seaborn as sns
import matplotlib.pyplot as plt
import numpy as np

# Generate some random data
data = {'value': np.random.randn(1000)}
df = pd.DataFrame(data)

# Create a histogram with a kernel density estimate
sns.histplot(data=df, x='value', kde=True)
plt.title("Histogram of a Distribution")
plt.show()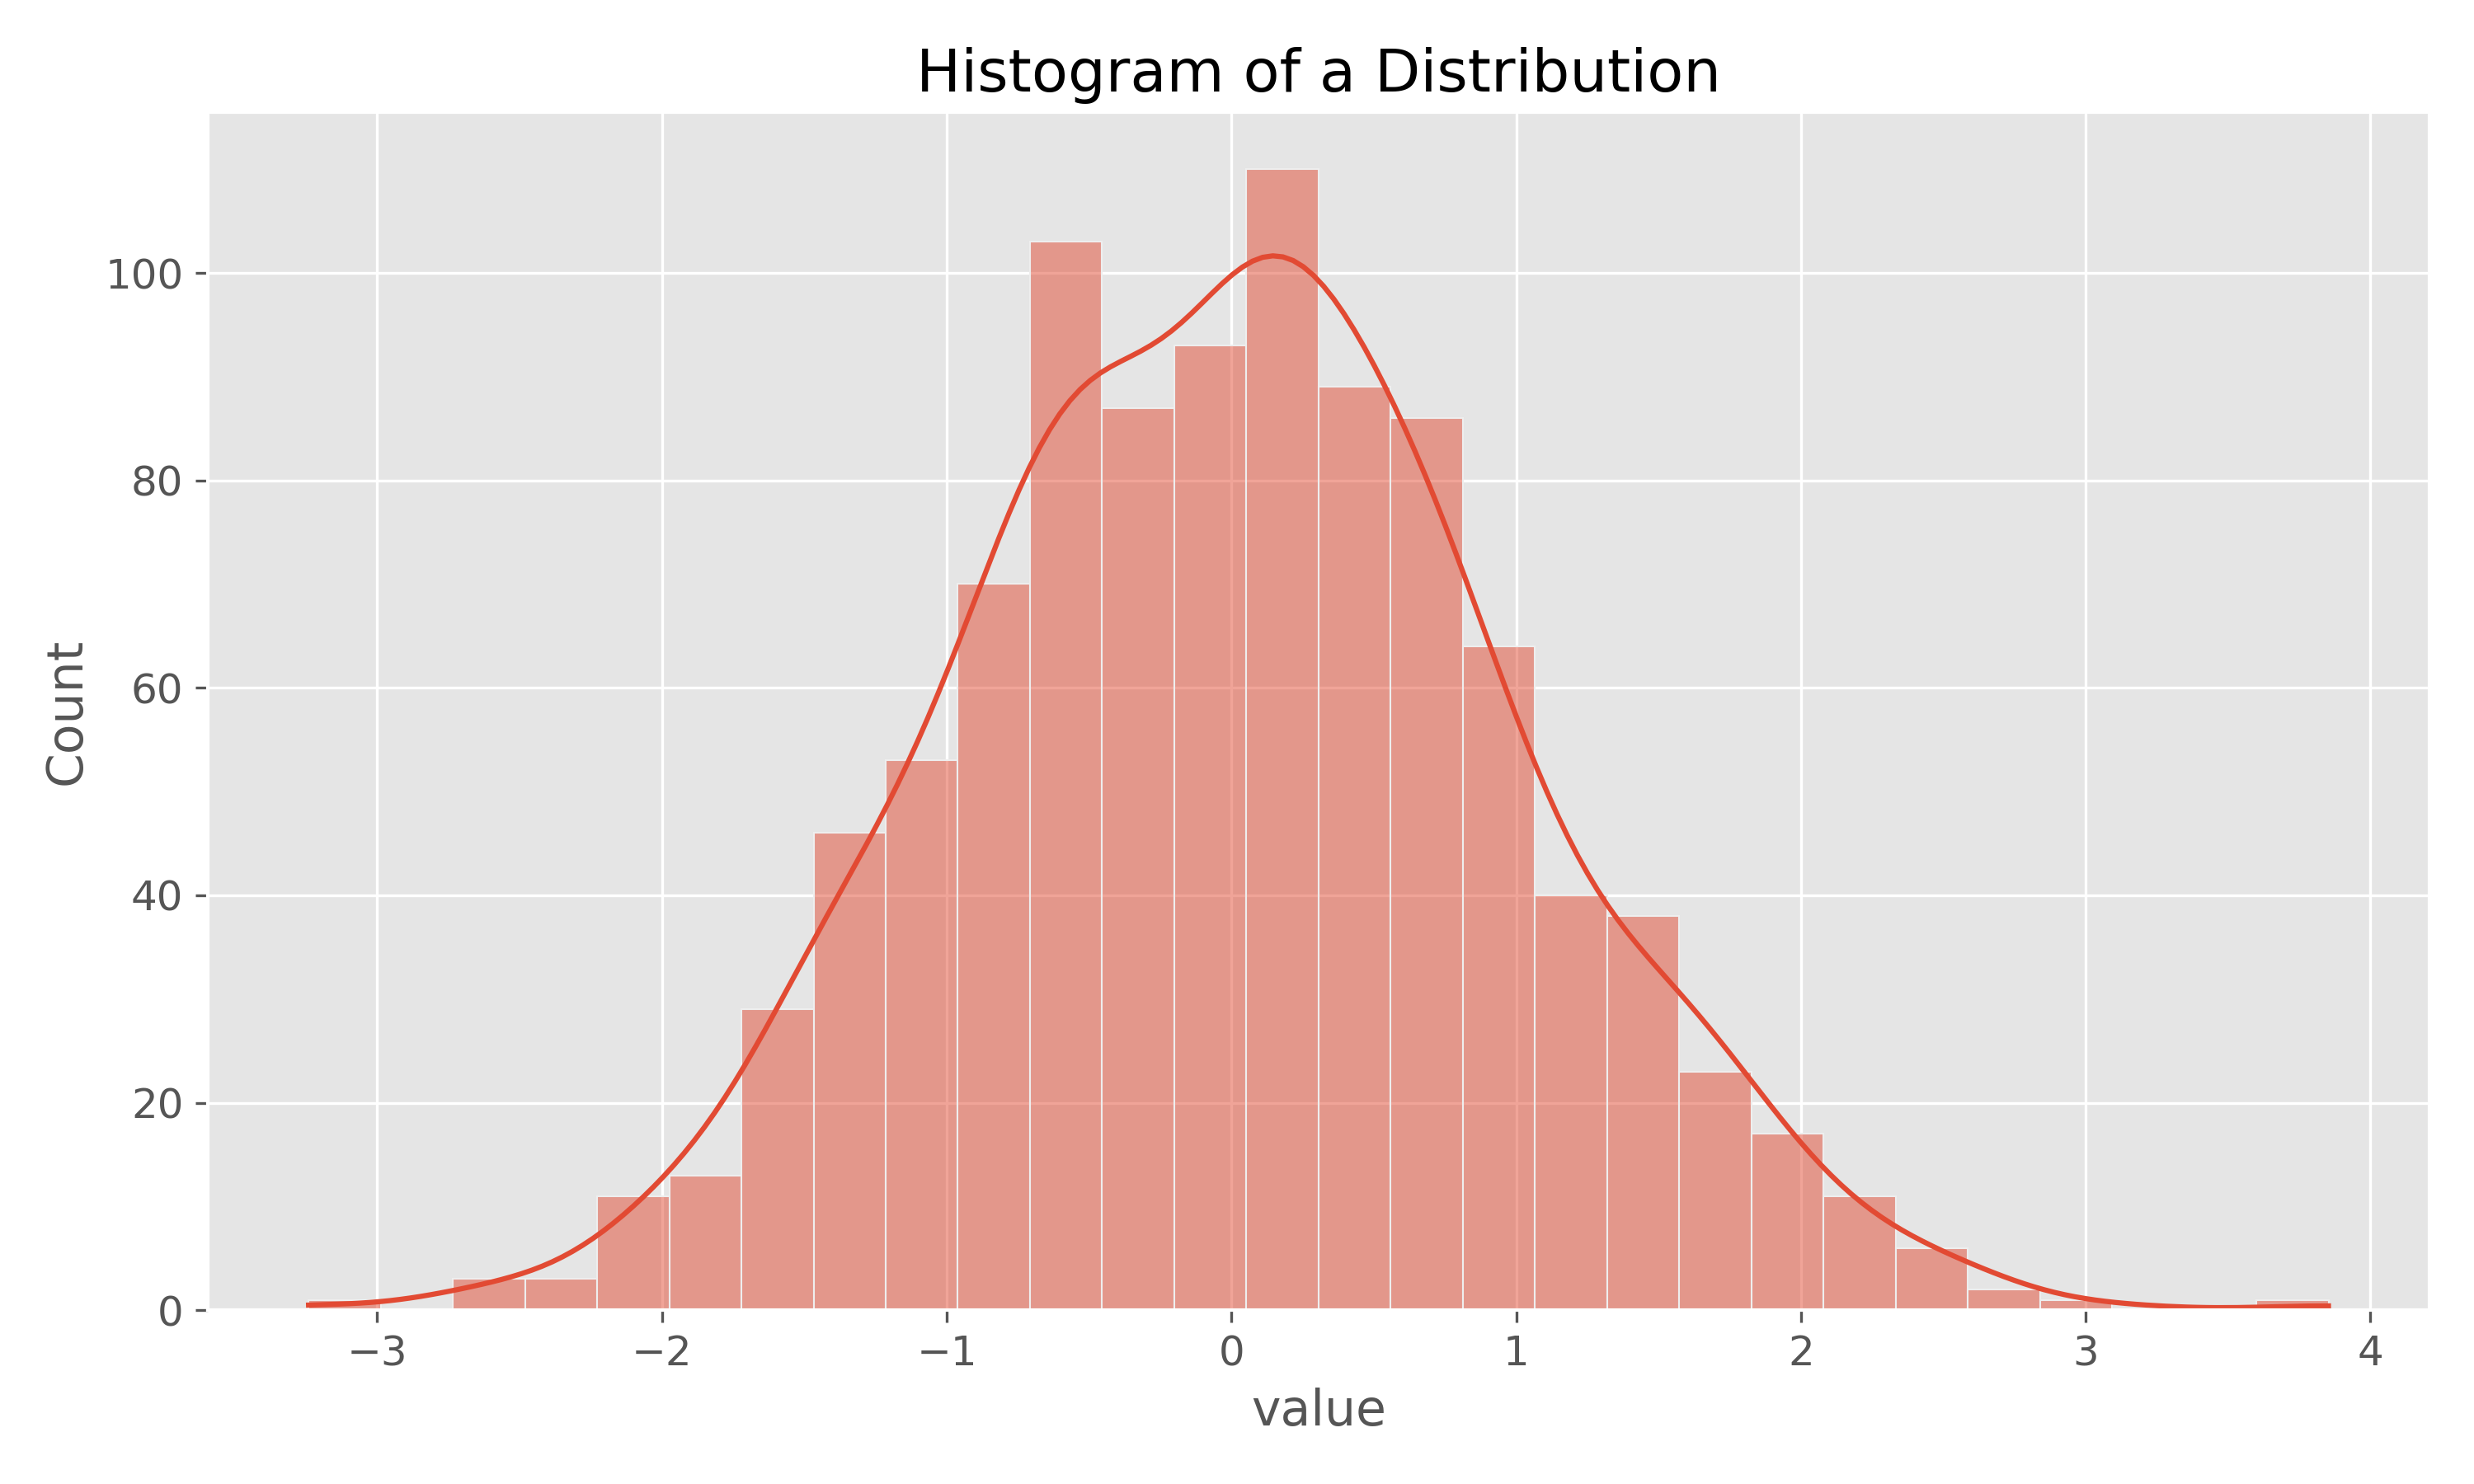
Pair Plot with Seaborn
A pair plot shows pairwise relationships in a dataset.
import pandas as pd
import seaborn as sns
import matplotlib.pyplot as plt

# Load a sample dataset from seaborn
iris = sns.load_dataset('iris')

# Create a pair plot
sns.pairplot(iris, hue='species')
plt.suptitle("Pair Plot of Iris Dataset", y=1.02)
plt.show()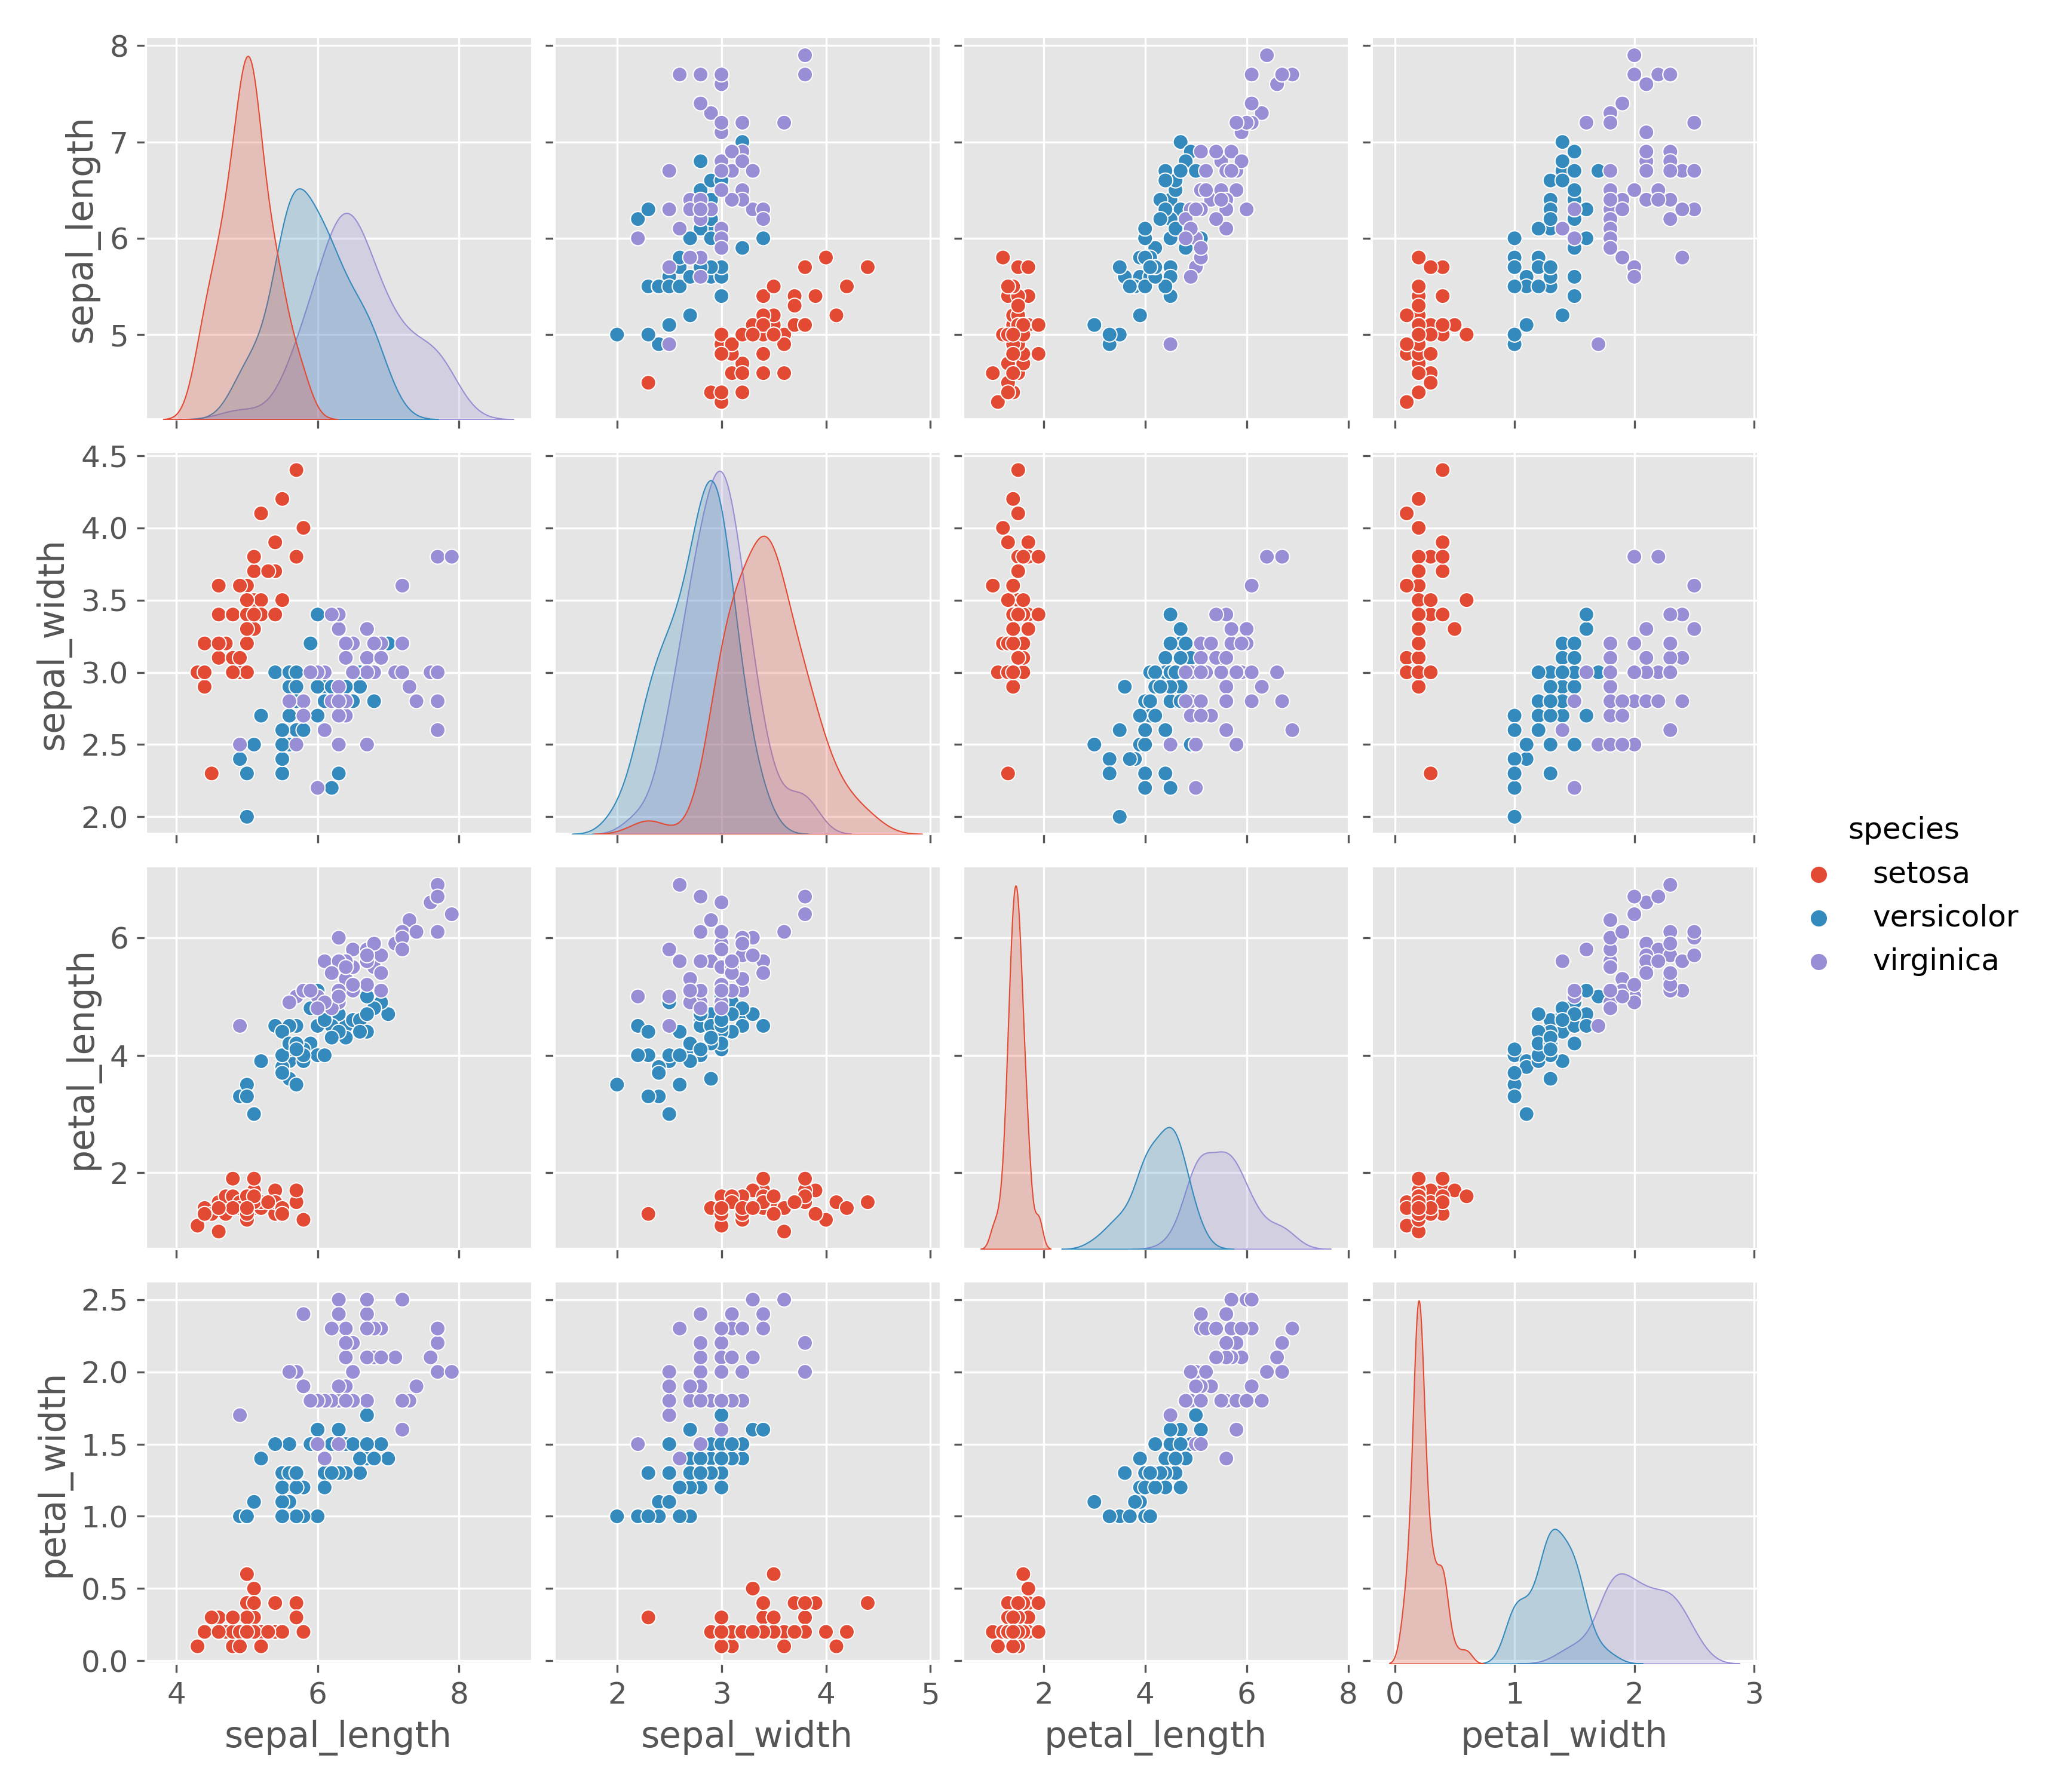
Additional Plot Types
Seaborn offers many other types of visualizations:
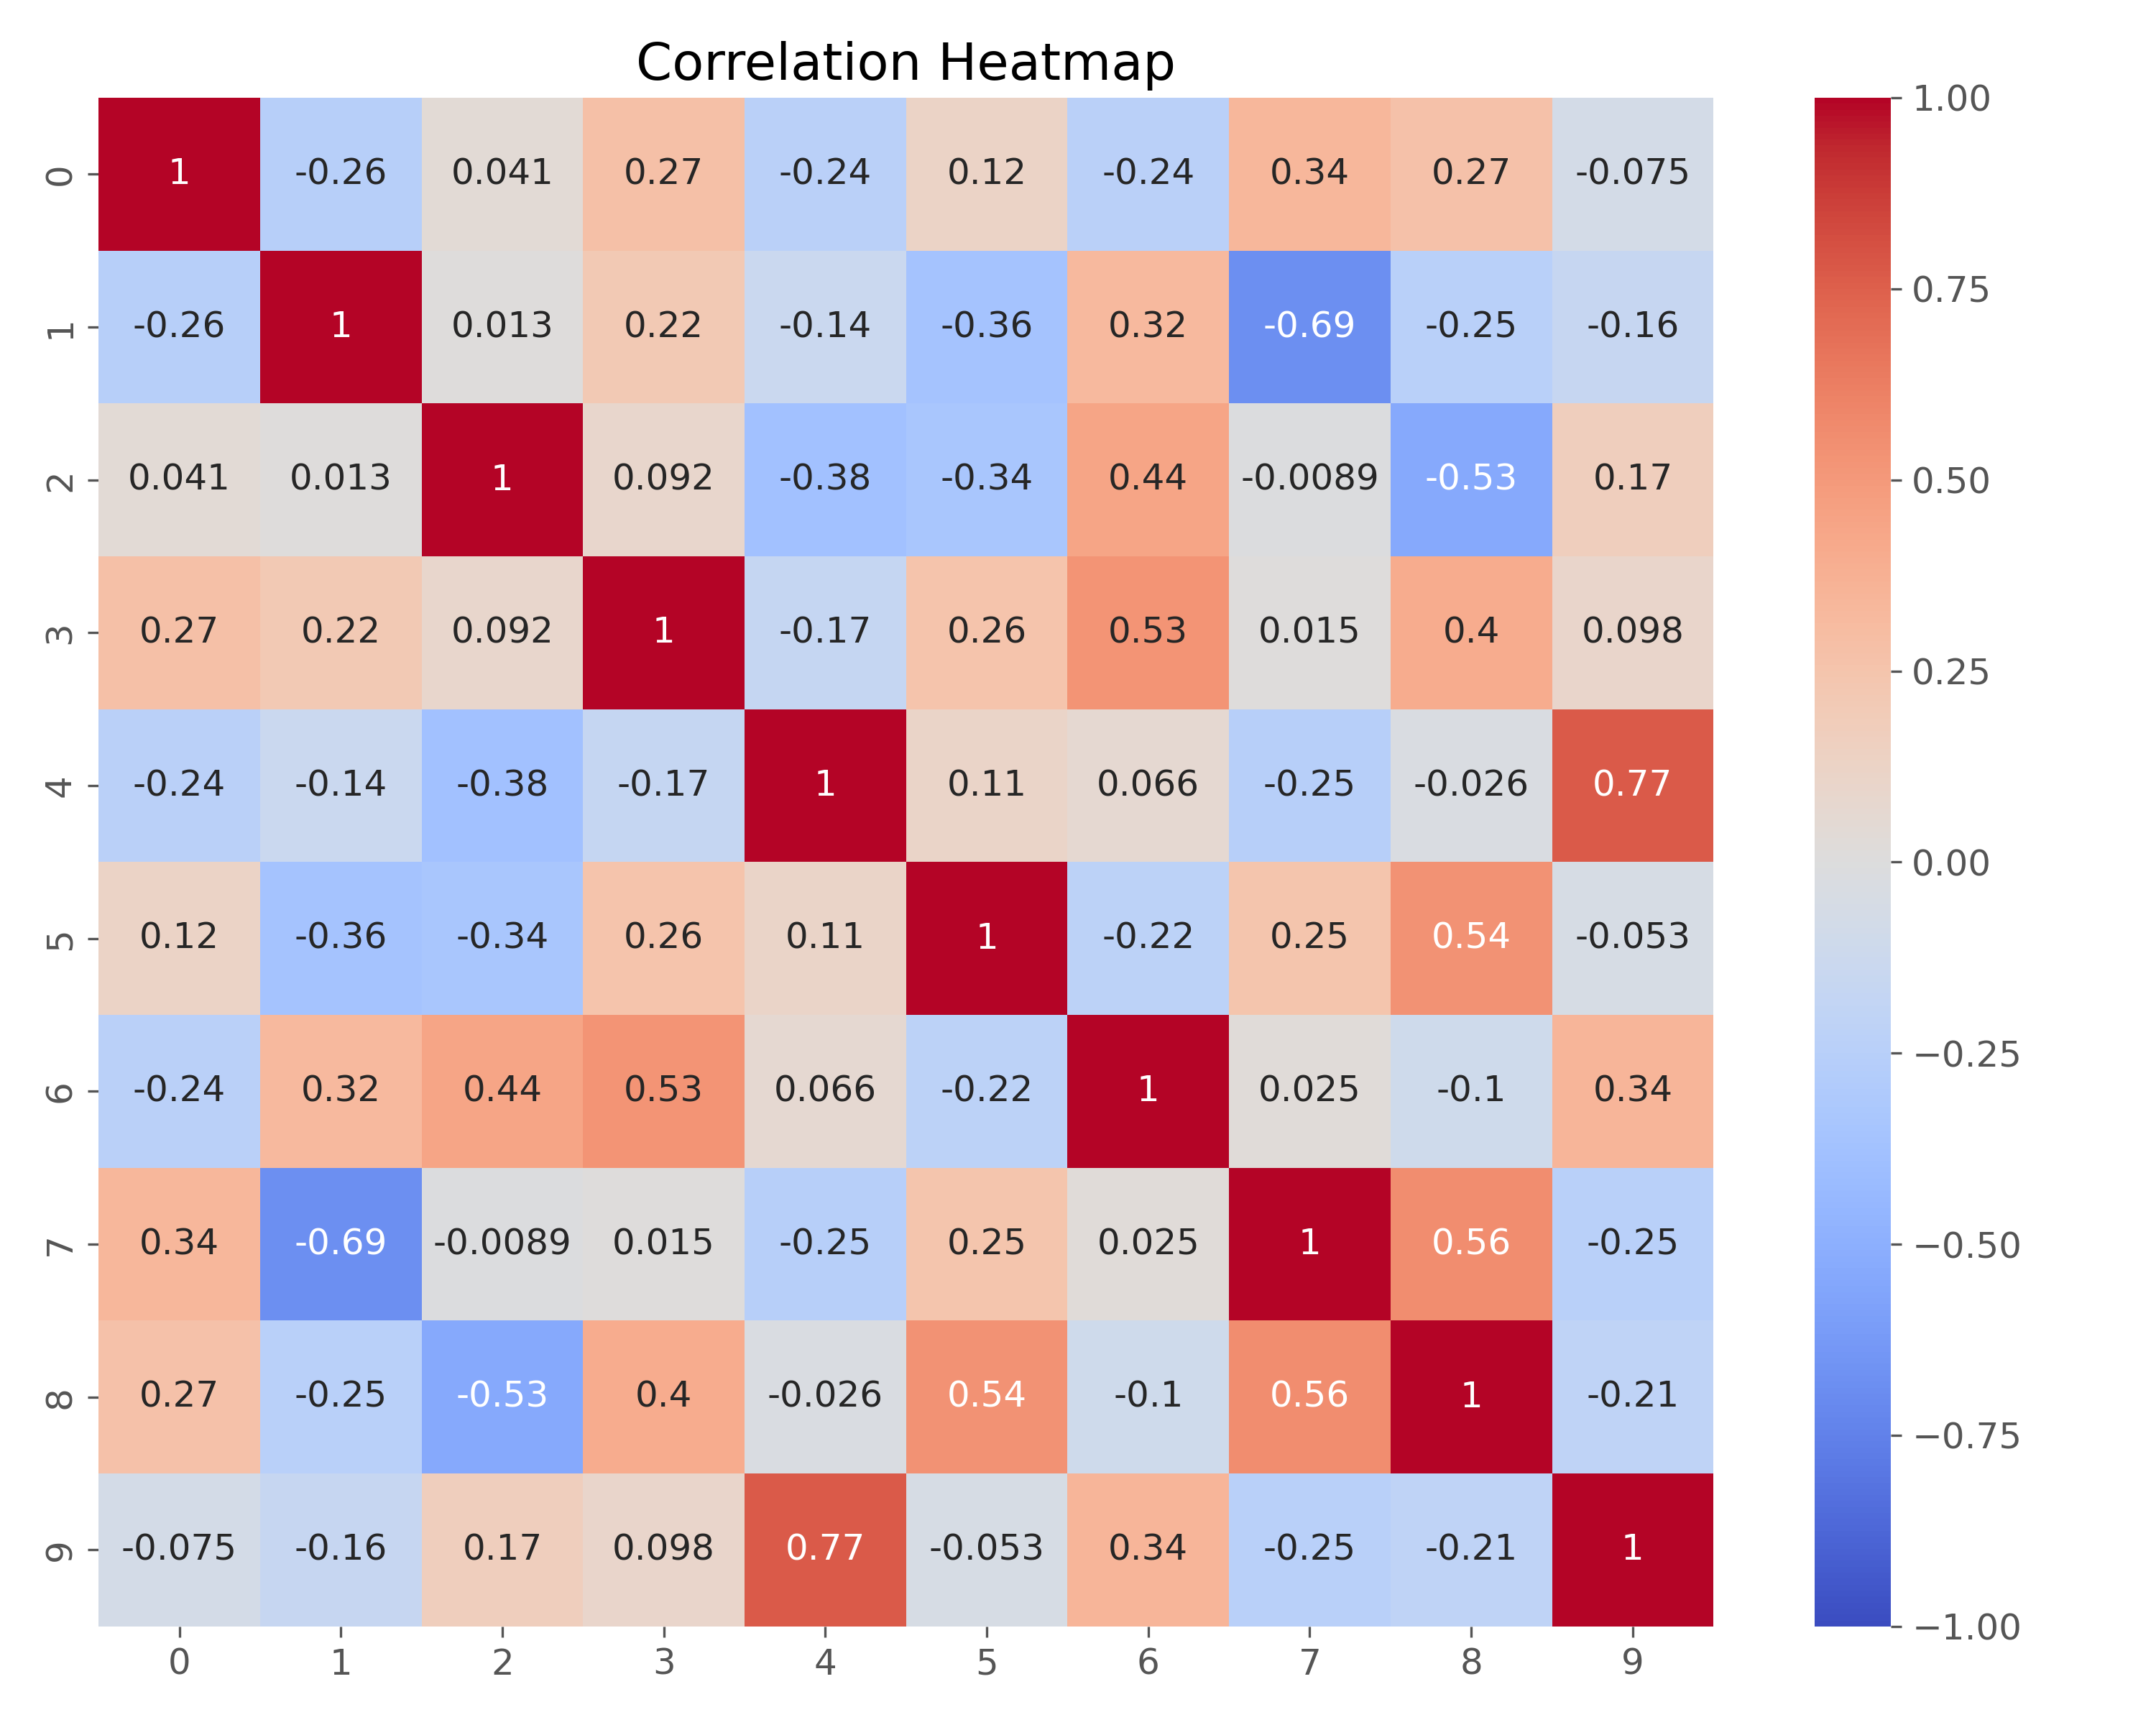
Heatmap
Heatmaps are excellent for visualizing correlation matrices:
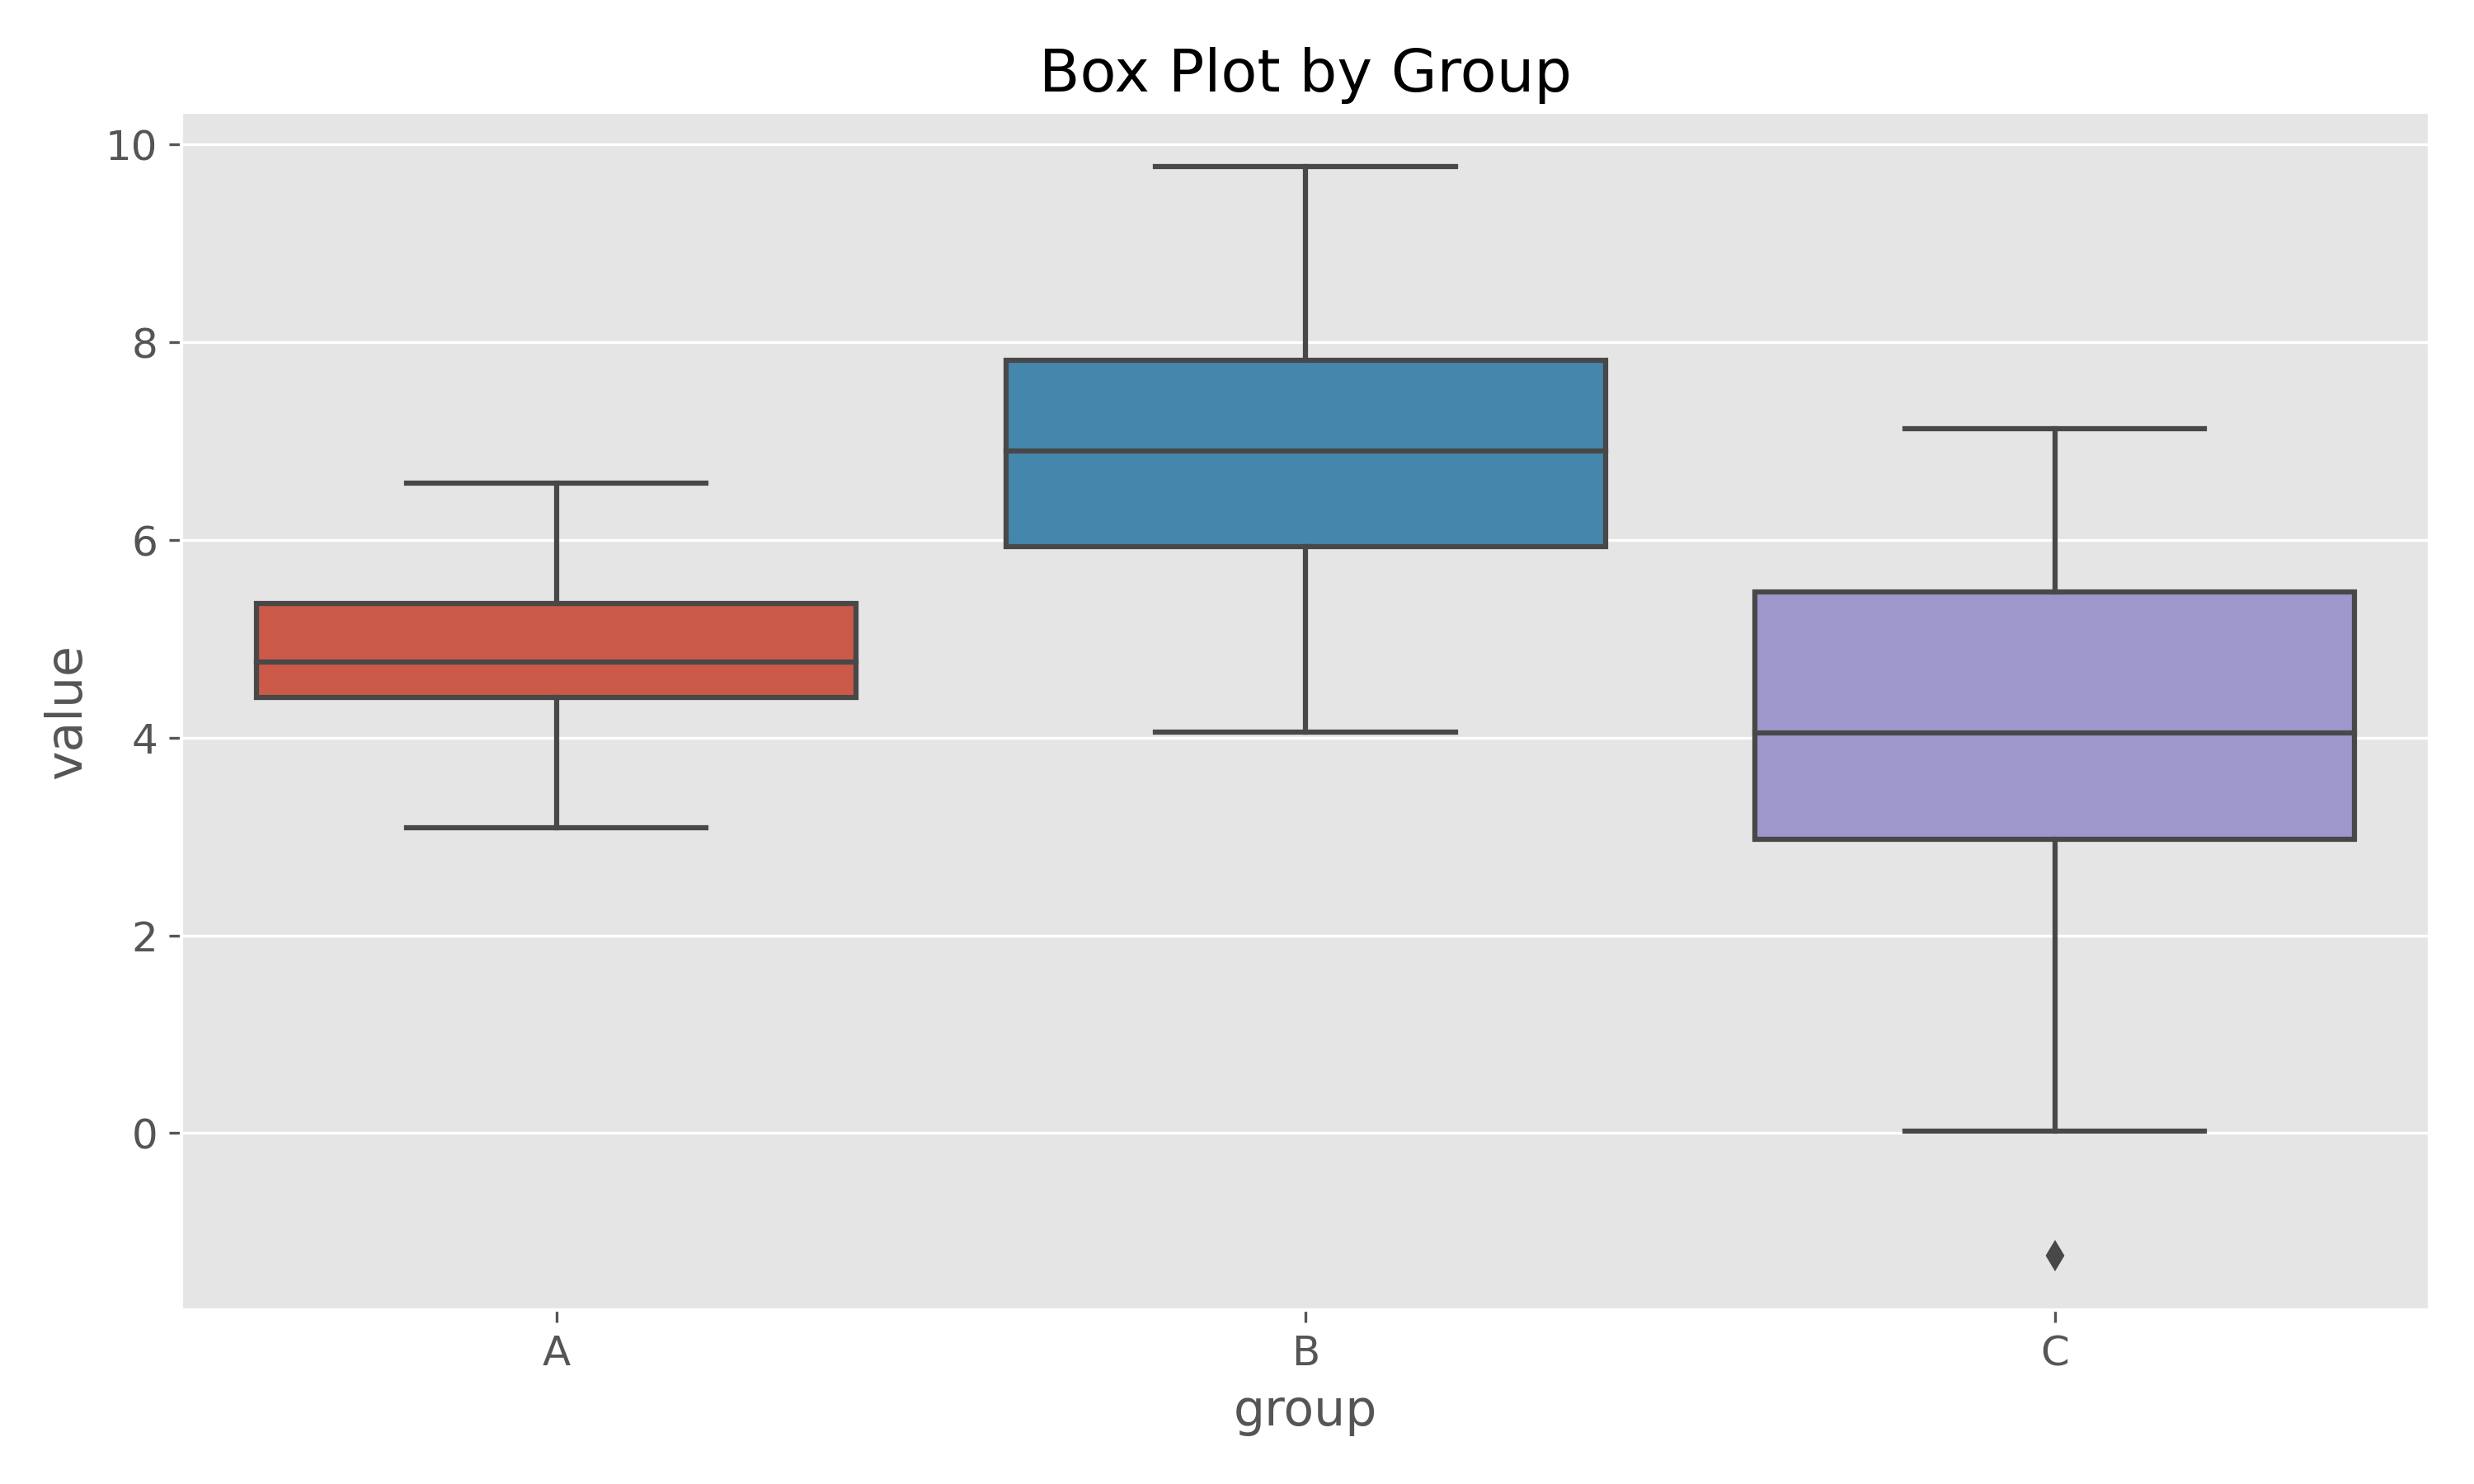
Box Plot
Box plots help visualize the distribution of data across different categories: